Eco Driving is an application designed to receive driving quality assessment. The assessment is made on the basis of penalties received for speedings, unreasonable accelerations/brakings/accelerations while cornering, reckless driving, and other violations which can be detected on the basis of created sensors. The analysis of received driving quality data may afterwards help you to prolong vehicle life, reduce fuel costs, ensure cargo safety, and also understand the reason for any case of emergency.
In order to receive driving quality assessment, you should adjust settings on the corresponding tab of a unit properties dialog.
Access Rights
To receive data, it is necessary to possess Query messages or reports right towards units.
To receive data about the Eco Driving settings of a unit, the access right View detailed item properties to the unit is needed.
To generate a table with driving quality assessment, it is necessary to possess View report templates right towards your account.
There are several elements in the application interface: top panel, statistics table (takes central place), work list (to the left of the statistics table), switching between tabs (above).
The time interval for which you would like to receive driving quality assessment should be indicated in the top panel. There are two variants available: established (Yesterday, Today, Week, Month) and adjustable interval (Custom) where any dates could be set. By clicking Previous/Next arrows an established interval is changed back or forth for a day, week, or month, correspondingly.
The work list is situated on the left and can consist of units or unit groups. The switching between the modes is done using the button  /
/ . By default, the work list is sorted by names arranged in direct alphabetic order. The order can be reversed. To do so, use the switch button
  /
/ in the header. To a find a unit o unit group quickly, use the dynamic filter above the list.
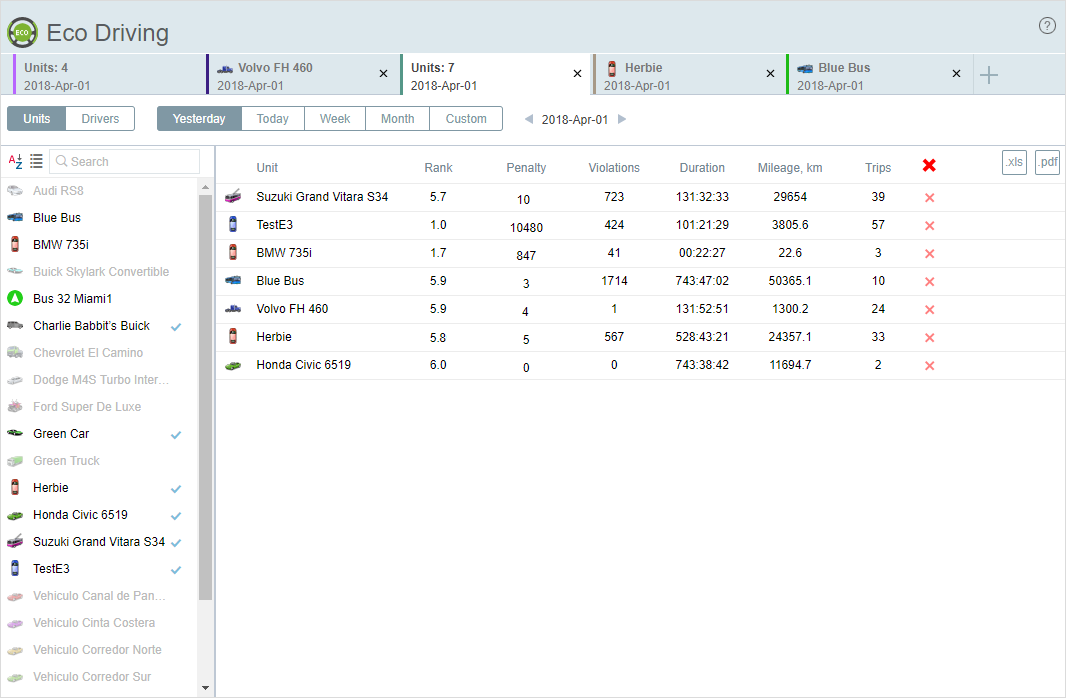
The selection of units (unit groups) is done using the arrow shaped button opposite to their names or by double clicks. The chosen units will be added to the table where the assessment will be automatically made. The following data is shown in the table: total amount of scored penalty points (driving quality assessment), number of violations, total duration, mileage, as well as number of trips for the chosen interval. The resulting table can be filtered by any of the indicated criteria (click a necessary one). The units added to the table are marked by flags in the list. A unit can be deleted from the resulting table along with all statistics data (deleting button in the last column of the table).
As mentioned before, there is a set of parameters for a driving quality assessment: speeding, acceleration, braking, acceleration while cornering, reckless driving, and also custom parameters depending on chosen sensors. These parameters should be chosen on Eco Driving tab of a unit properties dialog. Moreover, the amount of penalty points is indicated for each violation. Finally, the application converts the penalty points into a rank (6 point scoring system assessment). The following algorithm is used:
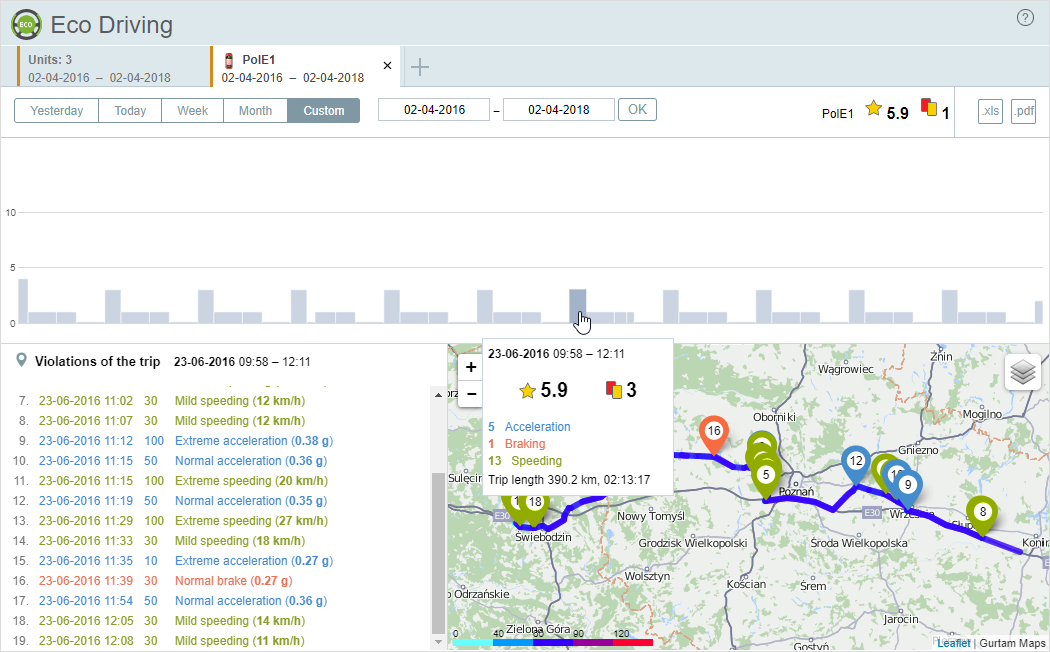
After the evaluation is made and the driving quality assessment (rank) is received there is a possibility to go into details of the assessment by clicking a unit's line in statistics table. After clicking it, you can see the following interface: trips (at the top of the screen), the map (a bit below), the violations table (to the left of the map).
Trips are displayed as columns. The width of the column is a ratio of a time spent in trip to the time of all the trips of a chosen interval. The height of the column is a driving quality score (to the left there is a scale with minimum and maximum penalty value on a chosen interval). Point the cursor on a column, and a tooltip containing the following information appears: date of a trip, time interval, mileage, duration, number of penalty points scored, rank, as well as number and type of the violations in a trip.
Click a trip's column in order its track to be displayed on the map. Track color depends on the unit speed (in the bottom left corner of the map there is a scale which indicates speed and its color). Violations on the track are shown by markers.
Gurtam Maps is used as a map source. The map can be scaled using the corresponding buttons in the upper left corner or using mouse scroll.
A list of violations made in a trip is shown on the left. The list is presented as a table and includes the following data: trip date, duration, type of violation and value of penalty points scored for it, and violation's value itself. Click a violation's marker on the map in order to highlight a corresponding line in the list
This option allows you to export unit or unit group data to a file. Two formats are supported: XLS (Excel) and PDF. To export the unit group data, press  /
/  (in accordance with the required format) in the header of the table to the right of the Clear list (
![]() ) button.
) button.
To get a file with the data about one unit, hover over the required unit and click on the button that appears at the end of the line. You can also export the data from the tab with the extended information about the unit. To do it, click on the corresponding button in the upper right corner of the work area.
Copyright © 2002–2020 Gurtam 